Hi, I’m Adil Wali. I became a Microsoft certified professional at age 14 and started my first web development company. That led to a career as a serial entrepreneur, advisor, and startup investor. I got my first “real job” at 33, and I’m now a FinTech executive with a passion for the markets.
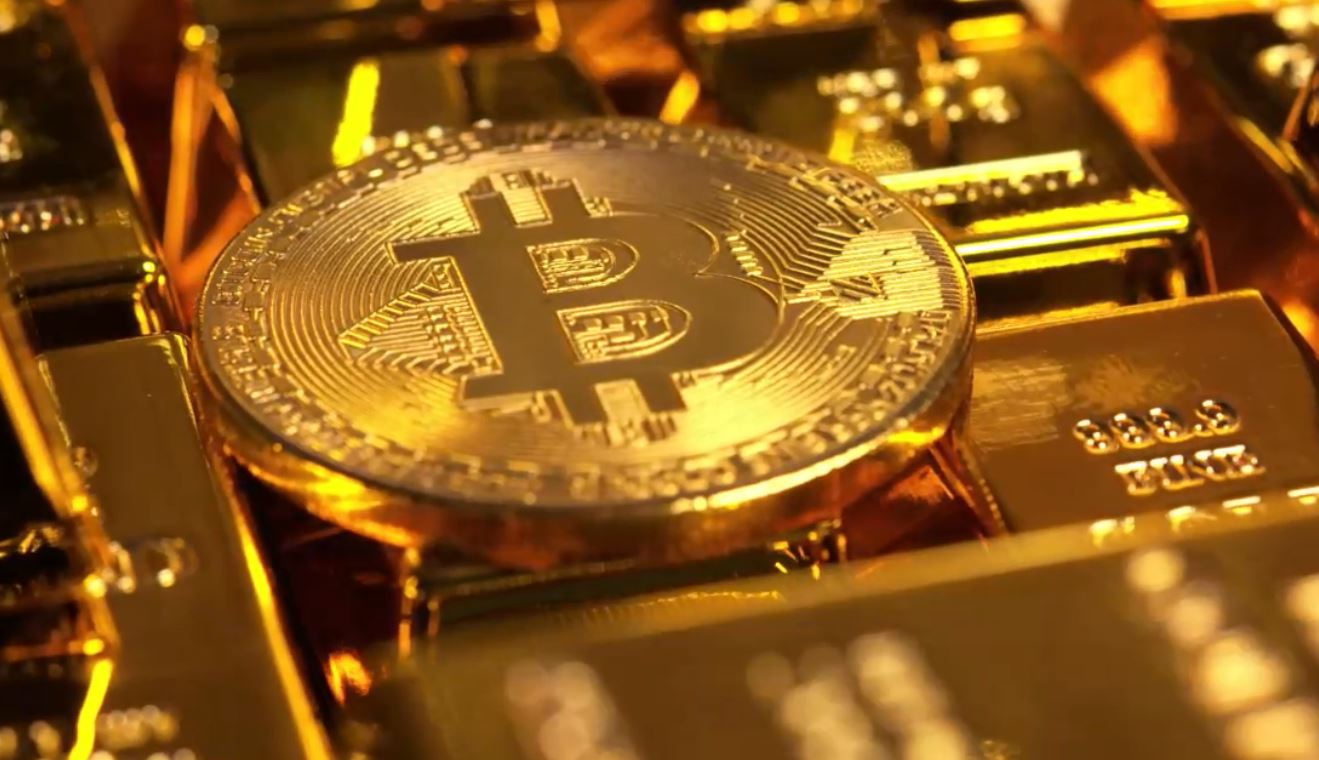
Gold in a world of uncertainty

By Adil Wali , 16th Aug 2019
CATEGORIES
Investing
Gold prices are continuing higher this week after reversing earlier weakness. This strength is being propelled by a weaker dollar, lower demand for risky assets, and plunging U.S. Treasury yields. The US equity market weakness in recent days has attracted capital to gold as a classic safe-haven.
Yet, I’m left wondering what this all means. Is this move into gold and other precious metals just part of the classic “flight for safety” in advance of (or in response to) a tumultuous market? Or is there more to the story? The one potential explanation that is particularly interesting to me goes like this: the U.S. economy may be less tumultuous than it seems. These moves into both U.S. Treasuries and precious metals are driven by negative interest rates around the world and a desire to earn some sort of safe return by global investors.
Let’s think about the factors more holistically.
Analysts predict a new U.S. recession, which is driving investors away from risk assets and into the safe-haven metals such as gold. Lower yields of stock markets reduce the opportunity cost of holding the non-yielding precious metals. With more than $1 trillion in publicly traded debt now yielding below zero, holding gold currently offers a nominal premium.
In this atmosphere of economic uncertainty, gold recovered from a turbulent couple weeks on Tuesday which drove the metal to a new high (since April 2013) at 1,535, but also to a 1-week low of 1,480. Technical conditions show overbought conditions and a possible consolidation phase in the short term. To the upside, 1,520 is the immediate resistance, followed by the high of 1,535. Above that point, 1,560 is the next significant inflection point.
An inversion of the yield curve, where 2-year yields trade higher than 10-year yields, is considered by some analysts to be a sign that the U.S. economy is likely to enter a recession. (Note that with bonds, yields move inversely with demand, meaning that they go down when demand is up.) Safe-haven currencies, gold, bonds, and other low-risk assets could continue to attract capital due to growing worries about the poor health of the global economy. This yield-curve inversion in the US and the UK triggered a wave of panic in the financial markets on Wednesday (the 14th of August.)
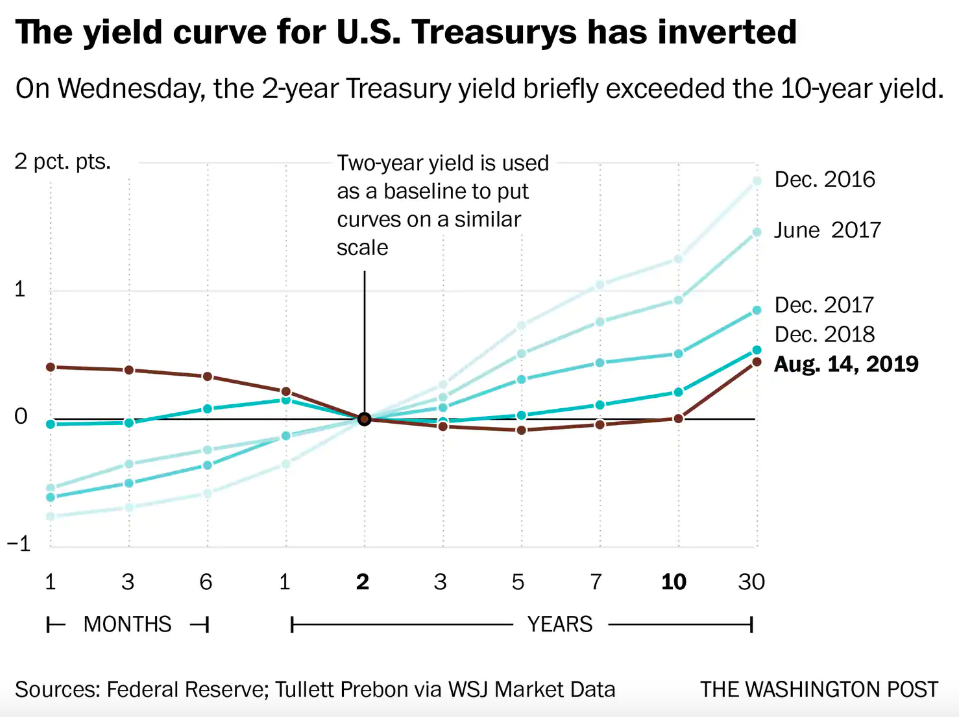
The panic is created because yield-curve inversions accurately predicted each of the last 7 recessions – including the “Great Recession”. Although, it is important to remember that while recessions are always preceded by yield-curve inversions, they do not always lead to recessions, says Kathy Lien, Managing Director Of FX Strategy For BK Asset Management. There are plenty of false positives and according to a Credit Suisse study, it could be 22 months before a recession follows.
The yield on the 10-Year Treasury note briefly fell below that of the 2-Year Treasury for the first time since 2007. When the yield curve inverts, it means that investors are paying higher yields for shorter-term securities. This indicates that investors are not only moving out of stocks and into safer bonds but also that they are worried about short-term prospects and piling into longer-term debt.
The yield on the 30-year bond hit an all-time low, while the yields on the German 10-year bund and the French 10-year OAT marked fresh record lows in negative territory, analyst Barani Krishnan mentions. There are many theories about the correlation between yield inversion and recession, but the key point to takeaway is a lack of confidence in the current interest-rate environment, specifically that yields will not be able to sustain their current rates over the long term.
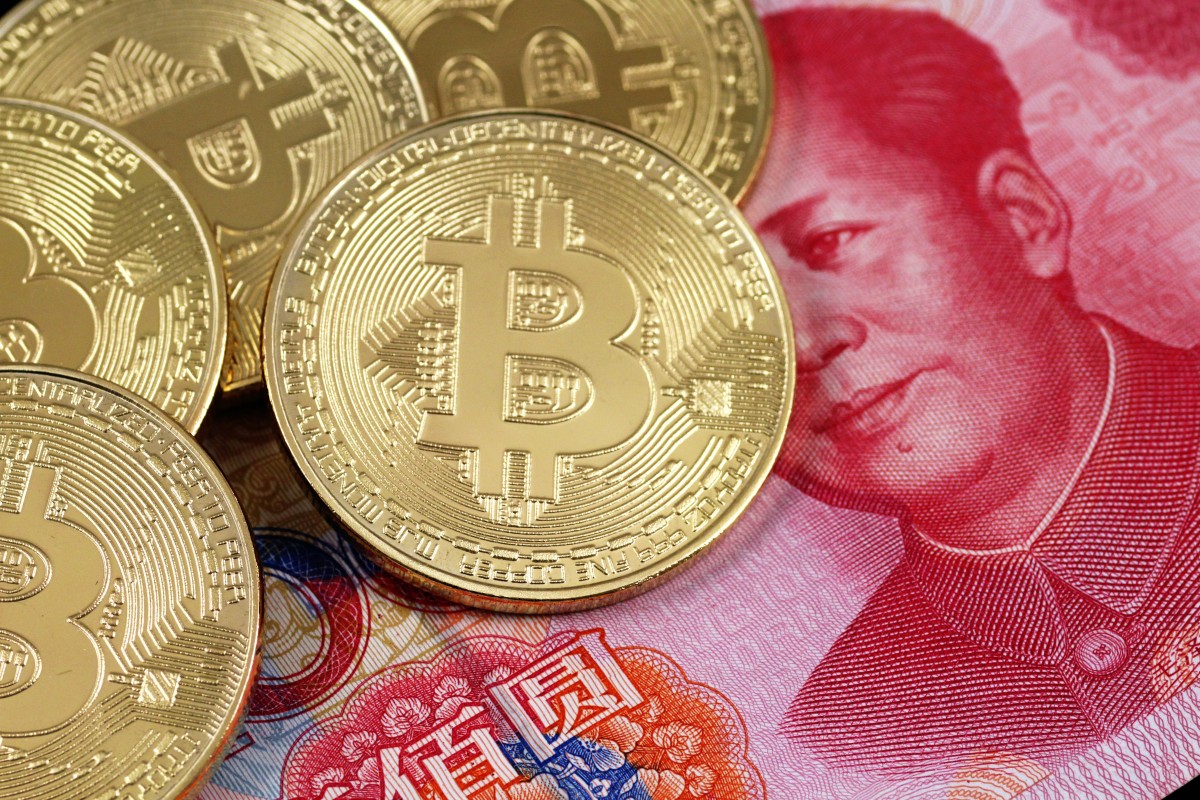
Also, Reuters reported on China recently, citing industry sources with knowledge that China has restricted the import of gold since May by some 300-500 tons compared with last year. This is meaningful, and worth $15-25 billion at current prices. China imports about one-third of the world’s total supply, buying about 1,500 tons of precious metal worth about $60 billion last year.
The restrictions come as an escalating trade confrontation with the United States has dragged China’s pace of growth to the slowest in nearly three decades and pressured the yuan to its lowest since 2008. Demand for gold jewelry in China and investment bars and coins has tripled in the last two decades as the country has rapidly become wealthier. According to official data, China’s gold reserves rose fivefold to nearly 2,000 tons.
Financial data that was released earlier showed that Chinese industrial-output growth hit its lowest level in 17 years, while the German economy contracted in the 2nd quarter. Analysts signaled both data points as signs of the negative impact from trade conflicts, especially the U.S.-China dispute. German Preliminary GDP came in at -0.1%, meeting expectations. Euro Zone Flash GDP also came in as expected at 0.2%. However, Euro Zone Industrial Production fell 1.6%, more than the 1.4% estimate. The previous month was revised lower to 0.8%.
Analysts from various institutions claim that gold continues to be a primary asset to hold in situations like this one. As long as geopolitical tensions, Brexit uncertainty, global growth concerns, and central banks easing monetary policy remain key themes, gold bulls are in control. But other precious metals did not have same growth recently, in September palladium fell $35.10, or 1.4%, to $1,416.40 an ounce, while October platinum lost $11.70, or 1.4%, at $848 an ounce. September copper fell 3.8 cents, or 1.4%, to $2.592 a pound.
Since the early 2000s, the precious metals have been making a comeback since gold traded to the $250 level and silver to just over $4 per ounce in 2001. The most liquid ETF products in the gold and silver market that hold physical metal are the SPDR Gold Shares (GLD) and the iShares Silver Trust (SLV). Analysts from ETF Daily News remind us that markets rarely move in a straight line. Gold and silver experienced more than a few failures to reach new highs after reaching highs in July 2016, but that period appears to be over.
However, the odds of price corrections will continue to increase as the price soars ever higher in the coming weeks and months. As weekly price ranges increase, the markets look great when they are rallying and scary during corrective periods. Many market participants find themselves buying highs and selling lows, as greed and fear are powerful emotions. Patience and discipline are often the attributes that separate those who profit during bull market periods from those who wind up with losses.
The SPDR Gold Shares was trading at $143.13 per share on Wednesday morning, up $1.35 (+0.95%). Year-to-date, GLD has gained 15.75%, versus a 7.51% rise in the benchmark S&P 500 index during the same period.
Besides, risk of further civil unrest in Hong Kong, trends in global growth, and at least one more interest rate cut from the Federal Reserve are all factors that are supportive for gold.
Also, according to data from Credit Suisse going back to 1978, here are some other important things to consider:
- The last five 2-10 inversions have eventually led to recessions.
- A recession occurs, on average, 22 months following a 2/10 year yield-curve inversion.
- The S&P 500 is up, on average, 12% one year after a 2-10 inversion.
- It’s not until about 18 months after an inversion when the stock market usually tips over and posts negative returns.
Trending Posts